by Calculated Risk on 9/04/2025 03:37:00 PM
From the Las Vegas Visitor Authority: July 2025 Las Vegas Visitor Statistics
Slower tourism trends of recent months continued in July as the destination saw a ‐12% YoY
decline in visitation, hosting approximately 3.1M visitors.The convention segment saw a YoY increase of 10.7% for the month, reflecting in part a scheduling
nuance of the World Market Center’s summer show (38k attendees) which appeared in July’s tally
this year; last year the show straddled Jul and Aug and showed up in 2024’s August tallies.Hotel occupancy of 76.1% (down ‐7.6 pts) and ADR of $155 (‐3.4% YoY) translated to monthly
RevPAR of $118 (‐12.1% YoY).
emphasis added
 Click on graph for larger image.
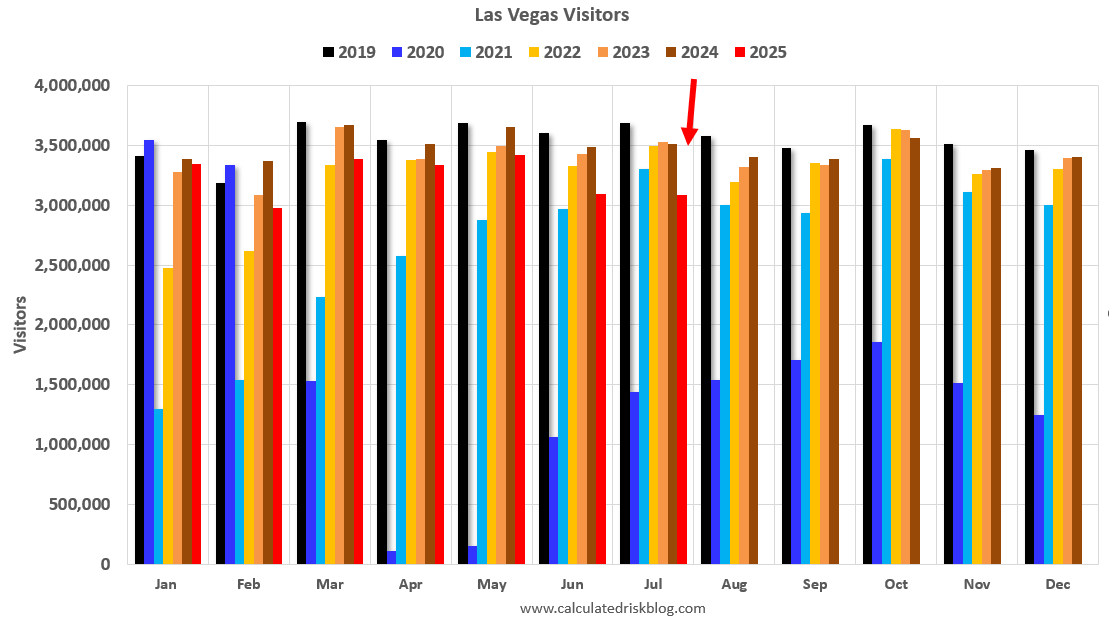
The first graph shows visitor traffic for 2019 (Black), 2020 (dark blue), 2021 (light blue), 2022 (light orange), 2023 (orange), 2024 (dark orange) and 2025 (red).
Visitor traffic was down 12.0% compared to last July. Visitor traffic was down 16.2% compared to June 2019.
The second graph shows convention traffic.

Convention traffic was up 10.7% compared to July 2024 and down 44.2% compared to July 2019.
YTD convention traffic is down 13.2% compared to 2019.