by Calculated Risk on 8/26/2025 09:00:00 AM
S&P/Case-Shiller released the monthly Home Price Indices for June (“June” is a 3-month average of April, May and June closing prices).
This release includes prices for 20 individual cities, two composite indices (for 10 cities and 20 cities) and the monthly National index.
From S&P S&P Cotality Case-Shiller Index Records Annual Gain in June 2025
The S&P Cotality Case-Shiller U.S. National Home Price NSA Index, covering all nine U.S. census
divisions, reported a 1.9% annual gain for June, down from a 2.3% rise in the previous month. The 10
City Composite increased 2.6%, down from a 3.4% rise in the previous month. The 20-City Composite
posted a year-over-year gain of 2.1%, down from a 2.8% increase in the previous month.The pre-seasonally adjusted U.S. National Index saw a slight upward trend, rising 0.1%. The 10-City
Composite and 20-City Composite Indices posted drops of -0.1% and -0.04%, respectively.
After seasonal adjustment, the U.S. National Index posted a decrease of -0.3%. The 10-City Composite
Index posted a -0.1% decrease and the 20-City Composite Index fell -0.3%.
…
“June’s results mark the continuation of a decisive shift in the housing market, with national home
prices rising just 1.9% year-over-year—the slowest pace since the summer of 2023,” said Nicholas
Godec, CFA, CAIA, CIPM, Head of Fixed Income Tradables & Commodities at S&P Dow Jones
Indices. “What makes this deceleration particularly noteworthy is the underlying pattern: The modest
1.9% annual gain masks significant volatility, with the first half of the period showing declining prices
(-0.6%) that were more than offset by a 2.5% surge in the most recent six months, suggesting the
housing market experienced a meaningful inflection point around the start of 2025.“The geographic divergence has become the story’s defining characteristic. New York’s 7.0% annual
gain stands as a stark outlier, leading all markets by a wide margin, followed by Chicago (6.1%) and
Cleveland (4.5%). This represents a complete reversal of pandemic-era patterns, where traditional
industrial centers now outpace former darlings like Phoenix (-0.1%), Tampa (-2.4%), and Dallas
(-1.0%). Tampa’s decline marks the worst performance among all tracked metros, while several
Western markets including San Diego (-0.6%) and San Francisco (-2.0%) have joined the negative
column—a remarkable transformation from their earlier boom years.
emphasis added

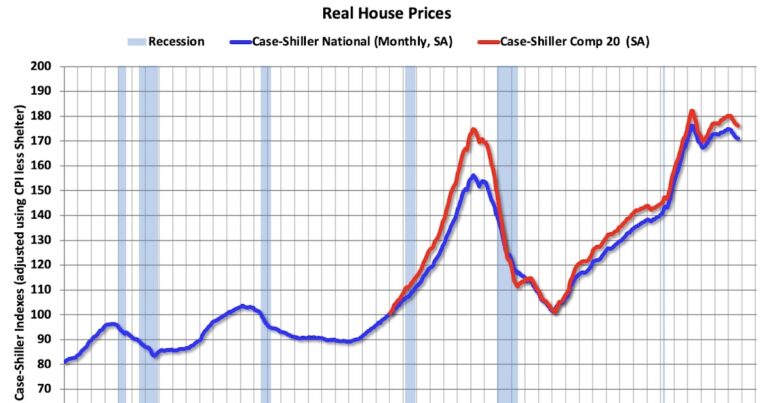
The first graph shows the nominal seasonally adjusted Composite 10, Composite 20 and National indices (the Composite 20 was started in January 2000).
The Composite 10 index was down 0.1% in June (SA). The Composite 20 index was down 0.3% (SA) in June.
The National index was down 0.3% (SA) in June.

The Composite 10 NSA was up 2.6% year-over-year. The Composite 20 NSA was up 2.1% year-over-year.
The National index NSA was up 1.9% year-over-year.
Annual price changes were close to expectations. I’ll have more later.


