by Calculated Risk on 10/28/2025 09:00:00 AM
S&P/Case-Shiller released the monthly Home Price Indices for August (“August” is a 3-month average of June, July and August closing prices).
This release includes prices for 20 individual cities, two composite indices (for 10 cities and 20 cities) and the monthly National index.
From S&P S&P Cotality Case-Shiller Index Records Annual Gain in August 2025
• The S&P Cotality Case-Shiller U.S. National Home Price NSA Index posted a 1.5% annual gain
for August, down from a 1.6% rise in the previous month.• Housing wealth eroded in real terms for the fourth consecutive month, with the 1.5% national
gain falling well short of 3% inflation.• Nineteen of 20 metros declined month-to-month in August, with only Chicago posting a gain,
signaling broad weakness beyond typical seasonal patterns.The S&P Cotality Case-Shiller U.S. National Home Price NSA Index, covering all nine U.S. census
divisions, reported a 1.5% annual gain for August, down from a 1.6% rise in the previous month. The
10-City Composite showed an annual increase of 2.1%, down from a 2.3% increase in the previous
month. The 20-City Composite posted a year-over-year increase of 1.6%, down from a 1.8% increase
in the previous month.New York again reported the highest annual gain among the 20 cities with a 6.1% increase in August,
followed by Chicago and Cleveland with annual increases of 5.9% and 4.7%, respectively. Tampa
posted the lowest return, falling 3.3%. …The pre-seasonally adjusted U.S. National, 10-City Composite, and 20-City Composite Indices
continued to report negative month-over-month change in August, posting -0.3% for U.S. national index
and -0.6% for both 10-City and 20-City Composite indices.After seasonal adjustment, all three indices posted a month-over-month increase of 0.2%.
…
“August’s data shows U.S. home prices continuing to slow, with the National Index up just 1.5% year-
over-year,” said Nicholas Godec, CFA, CAIA, CIPM, Head of Fixed Income Tradables & Commodities
at S&P Dow Jones Indices. “This marks the weakest annual gain in over two years and falls well below
the 3% inflation rate. For the fourth straight month, home values have lost ground to inflation, meaning
homeowners are seeing their real wealth decline even as nominal prices inch higher.“The National Index rose 1.5% over the past year, with most of that gain coming in the recent six
months (up 1.5%) while the prior six months were essentially flat. The 20-City Composite gained 1.6%
annually and the 10-City rose 2.1%, both continuing their deceleration from earlier in the year.
emphasis added
 Click on graph for larger image.
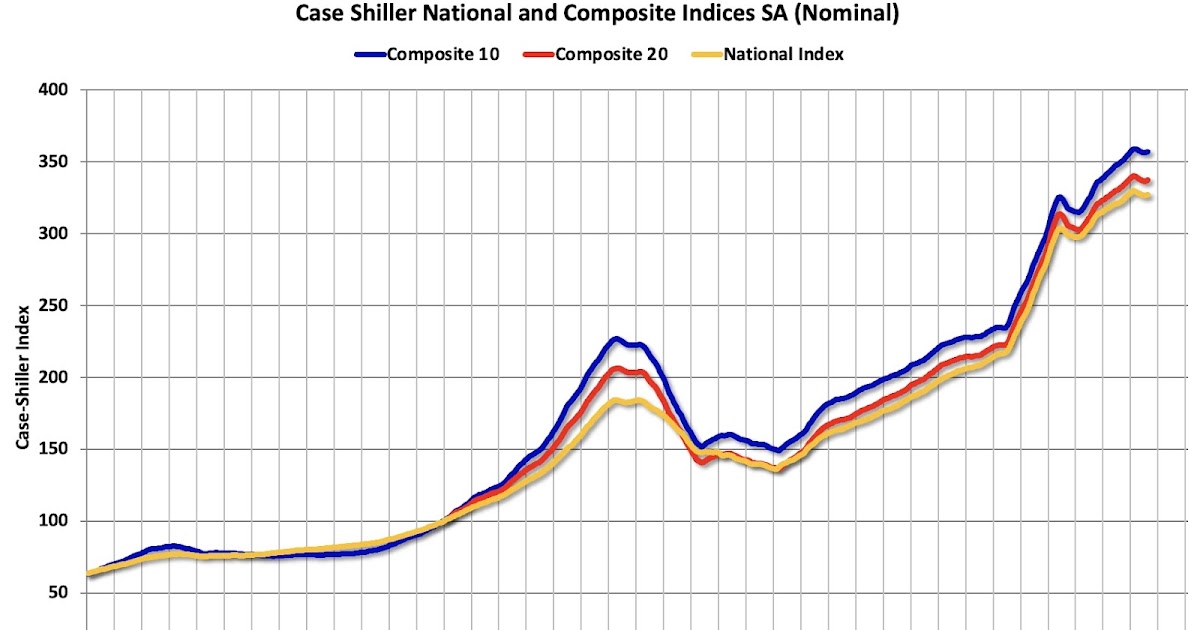
The first graph shows the nominal seasonally adjusted Composite 10, Composite 20 and National indices (the Composite 20 was started in January 2000).
The Composite 10 index was up 0.2% in August (SA). The Composite 20 index was up 0.2% (SA) in August.
The National index was up 0.2% (SA) in August.
 The second graph shows the year-over-year change in all three indices.
The Composite 10 NSA was up 2.1% year-over-year. The Composite 20 NSA was up 1.6% year-over-year.
The National index NSA was up 1.5% year-over-year.
Annual price changes were below expectations. I’ll have more later.