by Calculated Risk on 10/23/2025 10:00:00 AM
From the NAR: NAR Existing-Home Sales Report Shows 1.5% Increase in September
Month-over-month
• 1.5% increase in existing-home sales – seasonally adjusted annual rate of 4.06 million in September
• 1.3% increase in unsold inventory – 1.55 million units equal to 4.6 months’ supply
Year-over-year
• 4.1% increase in existing-home sales
• 2.1% increase in median existing-home sales price to $415,200
emphasis added
 Click on graph for larger image.
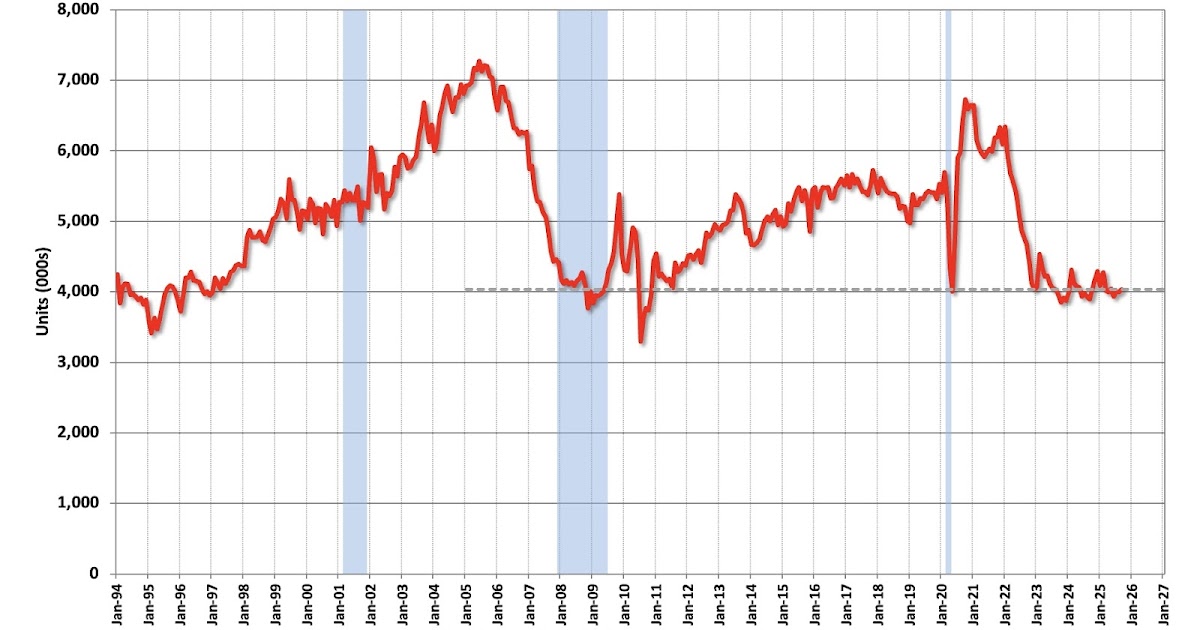
This graph shows existing home sales, on a Seasonally Adjusted Annual Rate (SAAR) basis since 1994.
Sales in September (4.06 million SAAR) were up 1.5% from the previous month and were up 4.1% compared to the September 2024 sales rate.
 According to the NAR, inventory increased to 1.55 million in September from 1.53 million the previous month.
The last graph shows the year-over-year (YoY) change in reported existing home inventory and months-of-supply. Since inventory is not seasonally adjusted, it really helps to look at the YoY change. Note: Months-of-supply is based on the seasonally adjusted sales and not seasonally adjusted inventory.
 Inventory was up 14.0% year-over-year (blue) in September compared to September 2024.
Months of supply (red) was unchanged at 4.6 months in September from 4.6 months the previous month.
I’ll have more later.