by Calculated Risk on 1/05/2026 08:11:00 AM
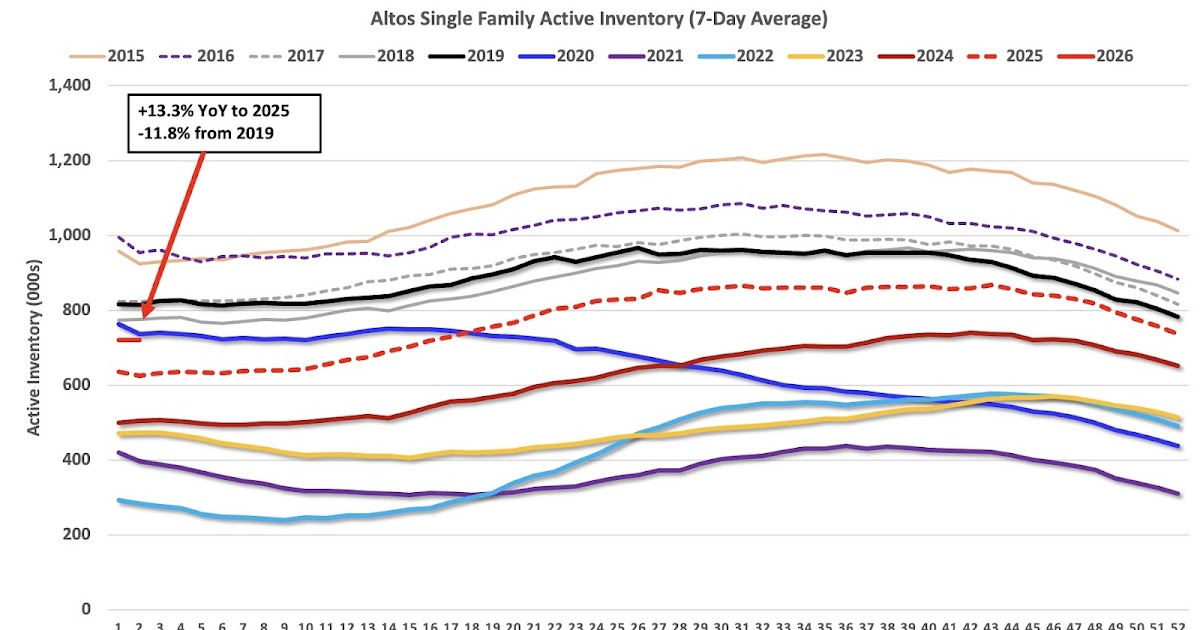
Altos reports that active single-family inventory was down 2.2% week-over-week.
Note that Inventory usually bottoms seasonally in January or February.
The first graph shows the seasonal pattern for active single-family inventory since 2015.
 Click on graph for larger image.
The red line is for 2025. The black line is for 2019.
Inventory was up 13.3% compared to the same week in 2025 (last week it was up 13.1%), and down 6.0% compared to the same week in 2019 (last week it was down 11.8%).
Inventory started 2026 down almost 12% compared to 2019.
 This second inventory graph is courtesy of Altos Research.
As of January 2nd, inventory was at 720 thousand (7-day average), compared to 736 thousand the prior week.