by Calculated Risk on 9/29/2025 08:11:00 AM
Altos reports that active single-family inventory was unchanged week-over-week. Inventory usually starts to decline in the fall and then declines sharply during the holiday season.
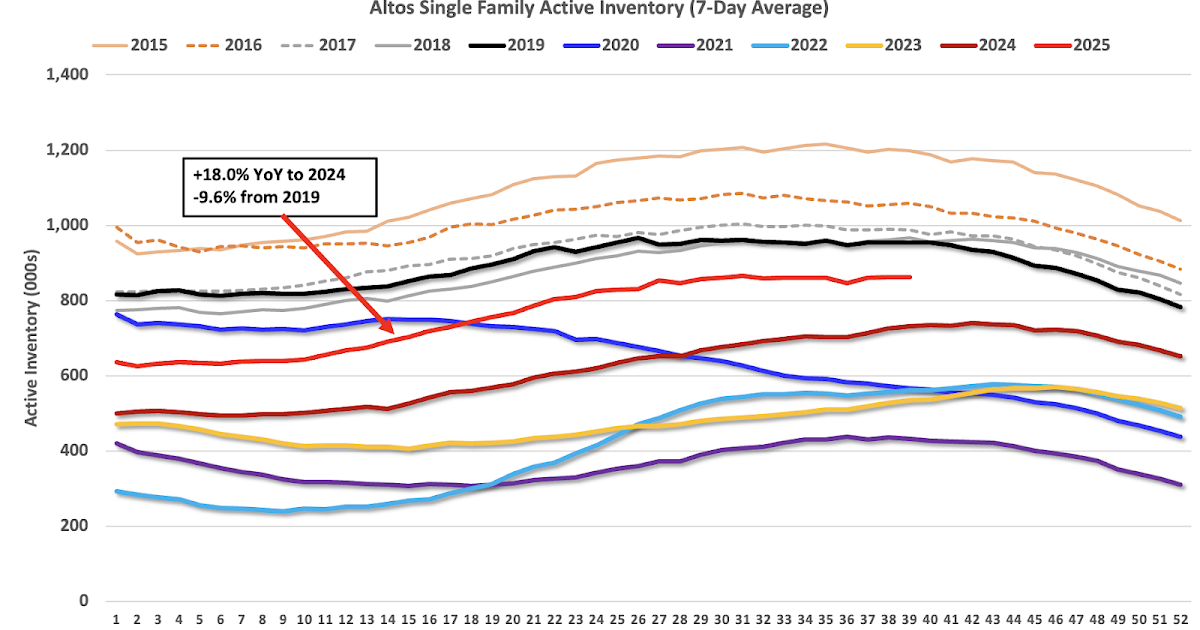
The first graph shows the seasonal pattern for active single-family inventory since 2015.
 Click on graph for larger image.
The red line is for 2025. The black line is for 2019.
Inventory was up 18.0% compared to the same week in 2024 (last week it was up 19.0%), and down 9.6% compared to the same week in 2019 (last week it was down 9.5%).
Inventory started 2025 down 22% compared to 2019. Inventory has closed more than half of that gap, but it appears inventory will still be below 2019 levels at the end of 2025.
 This second inventory graph is courtesy of Altos Research.
As of September 26th, inventory was at 863 thousand (7-day average), compared to 863 thousand the prior week.