by Calculated Risk on 9/27/2025 08:11:00 AM
The key report scheduled for this week is the September employment report on Friday.
Other key indicators include Case-Shiller house prices for July, the September ISM Manufacturing and Services indices, and September auto sales.
—– Monday, September 29th —–
10:00 AM: Pending Home Sales Index for August. The consensus is 0.1% increase in the index.
10:30 AM: Dallas Fed Survey of Manufacturing Activity for September.
—– Tuesday, September 30th —–
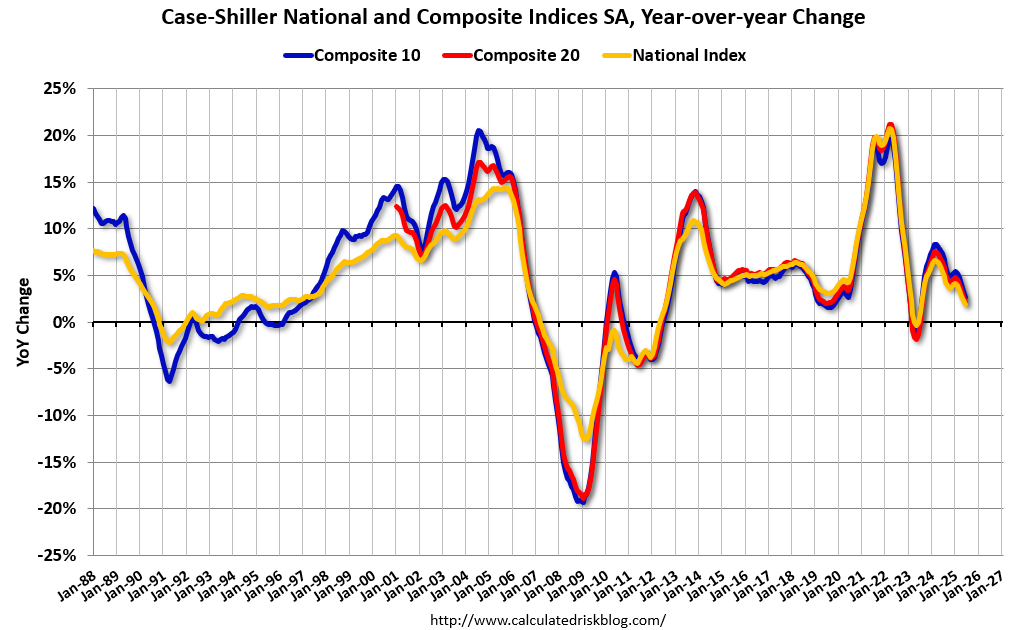
 9:00 AM: S&P/Case-Shiller House Price Index for July.
This graph shows the year-over-year change in the seasonally adjusted National Index, Composite 10 and Composite 20 indexes through the most recent report (the Composite 20 was started in January 2000).
The consensus is for a 2.3% year-over-year increase in the National index for July.
9:00 AM: FHFA House Price Index for July. This was originally a GSE only repeat sales, however there is also an expanded index.
9:45 AM: Chicago Purchasing Managers Index for September. The consensus is for a reading of 43.0, up from 41.5 in August.
 10:00 AM: Job Openings and Labor Turnover Survey for August from the BLS.
This graph shows job openings (black line), hires (purple), Layoff, Discharges and other (red column), and Quits (light blue column) from the JOLTS.
—– Wednesday, October 1st —–
7:00 AM ET: The Mortgage Bankers Association (MBA) will release the results for the mortgage purchase applications index.
8:15 AM: The ADP Employment Report for September. This report is for private payrolls only (no government). The consensus is for 48,000 jobs added, down from 54,000 in August.
10:00 AM: ISM Manufacturing Index for September. The consensus is for a reading of 49.2, up from 48.7 in August.
10:00 AM: Construction Spending for August. The consensus is for a 0.1% decrease.
—– Thursday, October 2nd —–
8:30 AM: The initial weekly unemployment claims report will be released. The consensus is for initial claims to increase to 220 thousand from 218 thousand last week.
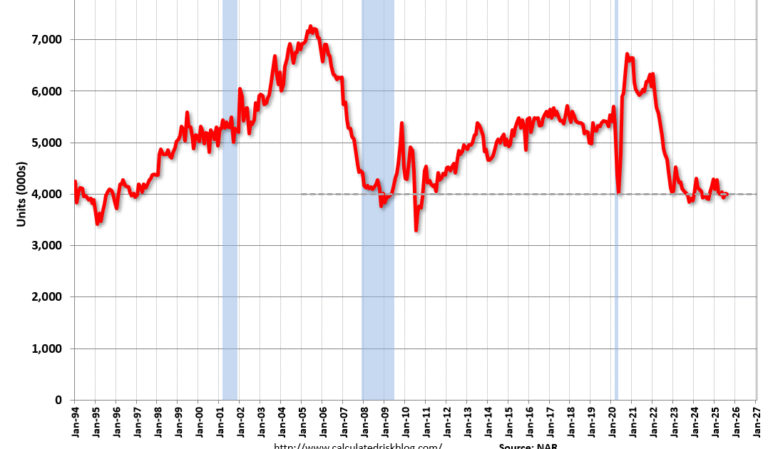
 All day: Light vehicle sales for September.
The consensus is for sales of 16.2 million SAAR, up from 16.1 million SAAR in August (Seasonally Adjusted Annual Rate).
This graph shows light vehicle sales since the BEA started keeping data in 1967. The dashed line is the current sales rate.
—– Friday, October 3rd —–
 8:30 AM: Employment Report for September. The consensus is for 43,000 jobs added, and for the unemployment rate to be unchanged at 4.3%.
There were 22,000 jobs added in August, and the unemployment rate was at 4.3%.
This graph shows the jobs added per month since January 2021.
10:00 AM: the ISM Services Index for September.