by Calculated Risk on 11/25/2025 09:00:00 AM
S&P/Case-Shiller released the monthly Home Price Indices for September (“September” is a 3-month average of July, August and September closing prices).
This release includes prices for 20 individual cities, two composite indices (for 10 cities and 20 cities) and the monthly National index.
From S&P S&P Cotality Case-Shiller Index Records Annual Gain in September 2025
• The S&P Cotality Case-Shiller U.S. National Home Price NSA Index posted a 1.3% annual gain
for September, down from a 1.4% rise in the previous month.• Inflation outpaced home prices for a fourth straight month, with September’s CPI running 1.7
percentage points above housing appreciation—the widest gap since the measures began
diverging in June.• All 20 metros recorded month-over-month declines before seasonal adjustment in September,
underscoring broad-based weakening as elevated mortgage rates weigh on affordability and
demand.S&P Dow Jones Indices (S&P DJI) today released the September
2025 results for the S&P Cotality Case-Shiller Indices.Please note that September 2025 transaction records for Wayne County, MI, are delayed at the local
recording office. Since Wayne is the most populous county in the Detroit metro area, Cotality is not able
to generate a valid September 2025 update of the Detroit S&P Cotality Case-Shiller Index before the
November 25, 2025, release date. …“The housing market’s deceleration accelerated in September, with the National Composite posting just
a 1.3% annual gain—the weakest performance since mid-2023,” said Nicholas Godec, CFA, CAIA,
CIPM, Head of Fixed Income Tradables & Commodities at S&P Dow Jones Indices. “This marks a
continued slide from August’s 1.4% increase and represents a stark contrast to the double-digit gains
that characterized the early post-pandemic era. National home prices continued trailing inflation, with
September’s CPI running 1.7 percentage points ahead of housing appreciation. This marks the widest
gap between inflation and home-price growth since the two measures diverged in June, with the spread
continuing to widen each month.“Regional performance reveals a tale of two markets. Chicago continues to lead with a 5.5% annual
gain, followed by New York at 5.2% and Boston at 4.1%. These Northeastern and Midwestern metros
have sustained momentum even as broader market conditions soften. At the opposite extreme, Tampa
posted a 4.1% annual decline—the sharpest drop among tracked metros and its 11th consecutive
month of negative annual returns. Phoenix (-2.0%), Dallas (-1.3%), and Miami (-1.3%) likewise
remained in negative territory, highlighting particular weakness in Sun Belt markets that experienced
the most dramatic pandemic-era price surges.
…
The S&P Cotality Case-Shiller U.S. National Home Price NSA Index, covering all nine U.S. census
divisions, reported a 1.3% annual gain for September, down from a 1.4% rise in the previous month.
The 10-City Composite showed an annual increase of 2.0%, down from a 2.1% increase in the previous
month. The 20-City Composite posted a year-over-year increase of 1.4%, down from a 1.6% increase
in the previous month.
…
The pre-seasonally adjusted U.S. National, 10-City Composite, and 20-City Composite Indices
continued to report negative month-over-month changes in September, posting -0.3% for the U.S.
National Index and -0.5% for both the 10-City and 20-City Composite Indices.After seasonal adjustment, the U.S. National and 10-City Composite Indices reported a monthly
increase of 0.2% and the 20-City Composite Indices posted a month-over-month gain of 0.1%.
emphasis added
 Click on graph for larger image.
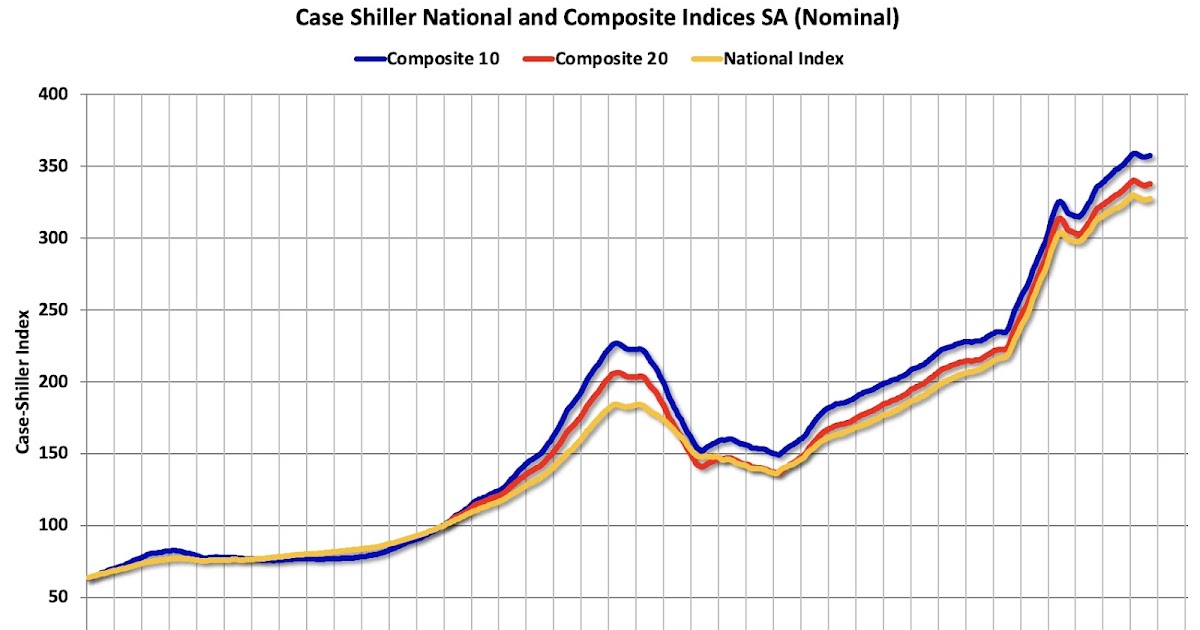
The first graph shows the nominal seasonally adjusted Composite 10, Composite 20 and National indices (the Composite 20 was started in January 2000).
The Composite 10 index was up 0.2% in September (SA). The Composite 20 index was up 0.1% (SA) in September.
The National index was up 0.2% (SA) in September.
 The second graph shows the year-over-year change in all three indices.
The Composite 10 NSA was up 2.0% year-over-year. The Composite 20 NSA was up 1.4% year-over-year.
The National index NSA was up 1.3% year-over-year.
Annual price changes were below expectations. I’ll have more later.