by Calculated Risk on 10/30/2025 08:52:00 AM
Today, in the Calculated Risk Real Estate Newsletter: Inflation Adjusted House Prices 2.8% Below 2022 Peak
Excerpt:
It has been 19 years since the housing bubble peak, ancient history for many readers!
In the August Case-Shiller house price index released Tuesday, the seasonally adjusted National Index (SA), was reported as being 77% above the bubble peak. However, in real terms, the National index (SA) is about 9.6% above the bubble peak (and historically there has been an upward slope to real house prices). The composite 20, in real terms, is 1.0% above the bubble peak.
People usually graph nominal house prices, but it is also important to look at prices in real terms. As an example, if a house price was $300,000 in January 2010, the price would be $446,000 today adjusted for inflation (49% increase). That is why the second graph below is important – this shows “real” prices.
The third graph shows the price-to-rent ratio, and the fourth graph is the affordability index. The last graph shows the 5-year real return based on the Case-Shiller National Index.
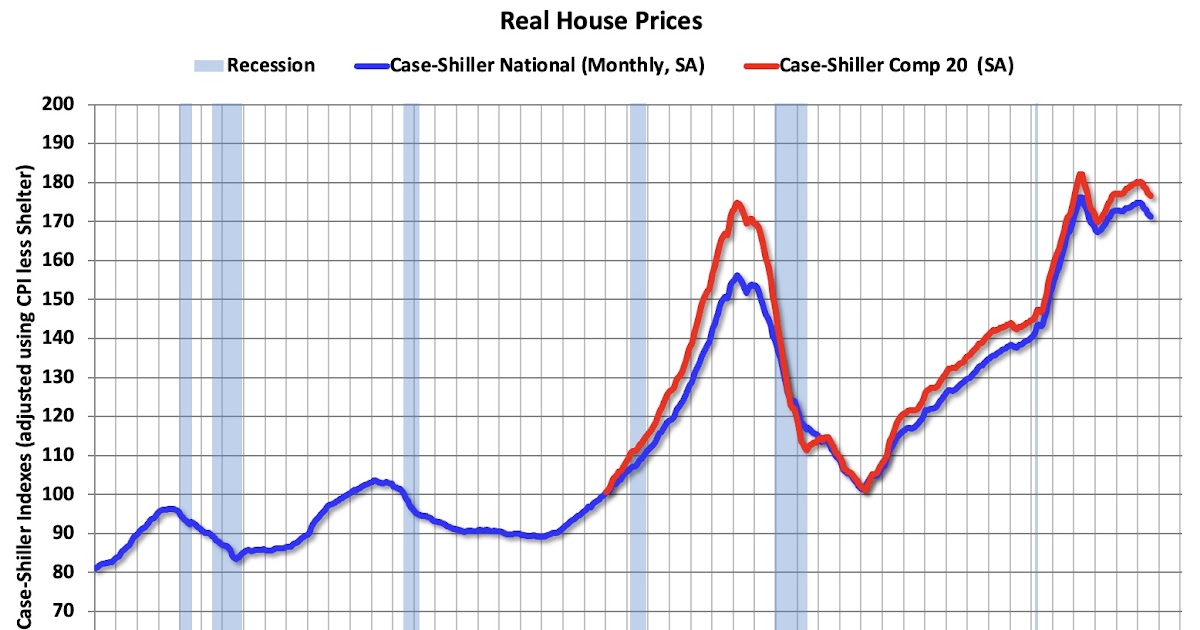
…The second graph shows the same two indexes in real terms (adjusted for inflation using CPI).
In real terms (using CPI), the National index is 2.8% below the recent peak, and the Composite 20 index is 3.1% below the recent peak in 2022.
Both the real National index and the Comp-20 index decreased in August. The real National index has decreased for 8 consecutive months.
It has now been 39 months since the real peak in house prices. Typically, after a sharp increase in prices, it takes a number of years for real prices to reach new highs (see House Prices: 7 Years in Purgatory)
 The second graph shows the same two indexes in real terms (adjusted for inflation using CPI).
There is much more in the article!